|
AIM 1 To form an empirically based estimate of expected cloud-free daily global solar radiation (irradiance on a horizontal surface), RS0, at selected locations.
AIM 2 To parameterize RS0 by Julian day and location. (Nomenclature RS0 and RS follows FAO56 usage).
DATA The data used were satellite observations of daily Global Radiation as provided by the Bureau of Meteorology from 117 sites over Australia (see map at Figure 1). Each data site comprises ~ 1500 observations of the total global radiation on a horizontal surface for the period Oct 1997 to Dec 2001. Each reading is representative of about 5km and is in units of MJ/m2.
|


|
Figure 2 Fourier components of 116 envelope curves plotted against latitude. Physical interpret ation is that the annual mean of RS0 decreases poleward, the seasonality increases poleward peaking at the summer solstice, and a weak semi-annual cycle, peaking in spring and autumn, decreases poleward. |
|
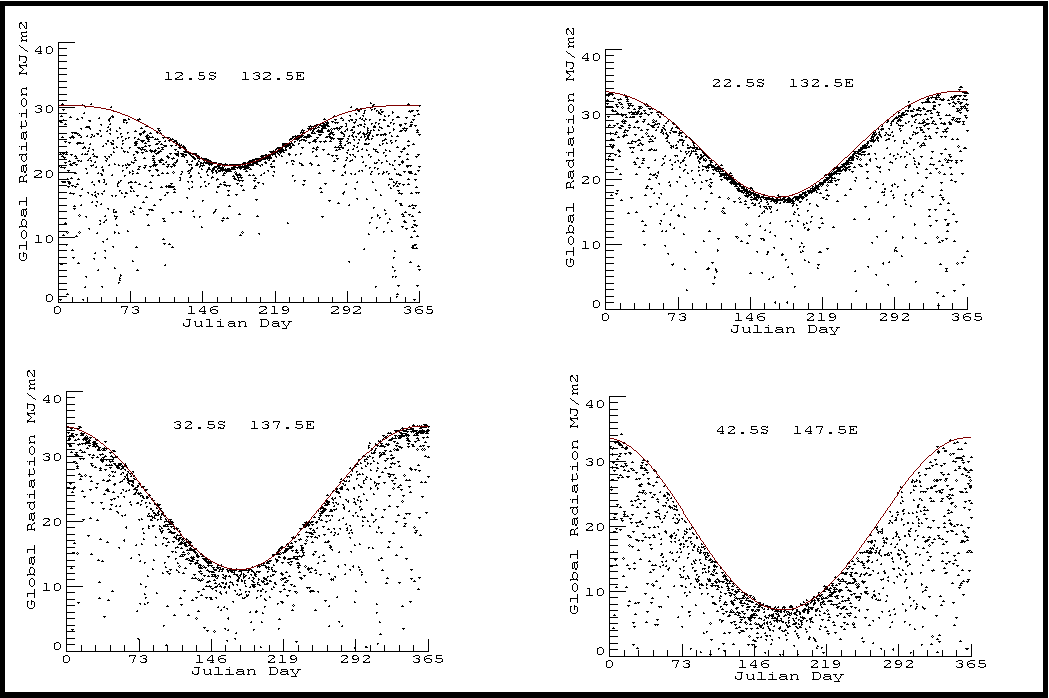
Figure 3 Daily Global Radiation observations plotted against Julian day for the four sample sites shaded in blue (see map). Red curve is envelope fitted using Fourier constants calculated from Equation 3 with values from Table 1. For sites “near” (a) Darwin, (b) Alice Springs, (c) Port Augusta and (d) Hobart. |
|
b |
|
a |
|
d |
|
c |
|
b |
|
c |
|
a |

|
MODELLING
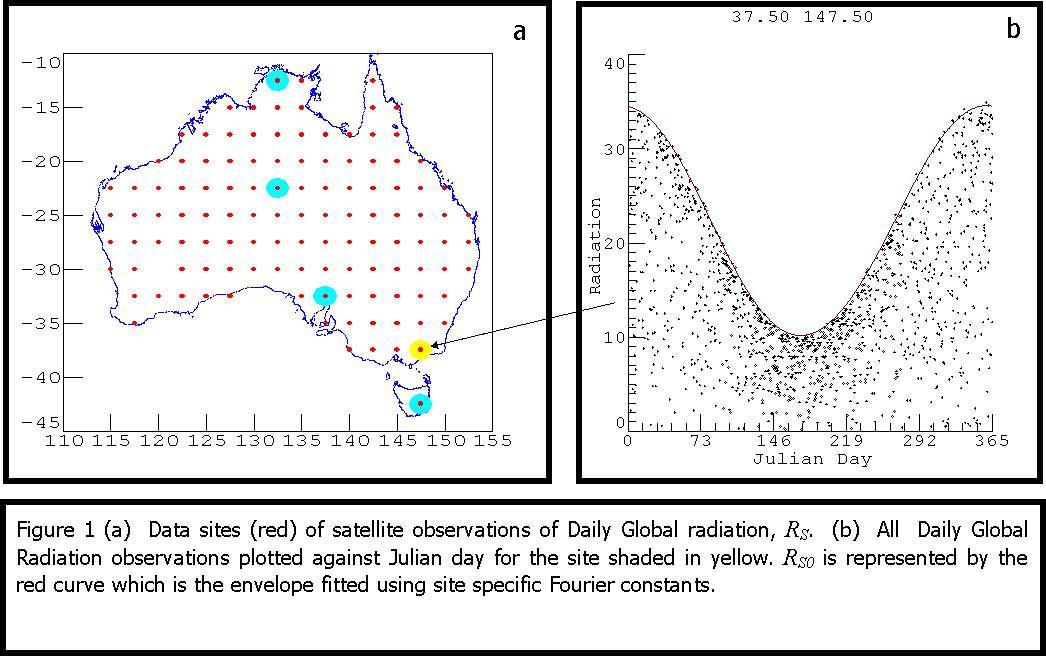
It is assumed that the Long-term Cloud-free Daily Global Radiation, RS0, is represented by the envelope curve of all the observations of Daily Global Radiation, RS, in relation to the Julian day, J. Figure 1(b) shows an example from a site in the Gippsland.
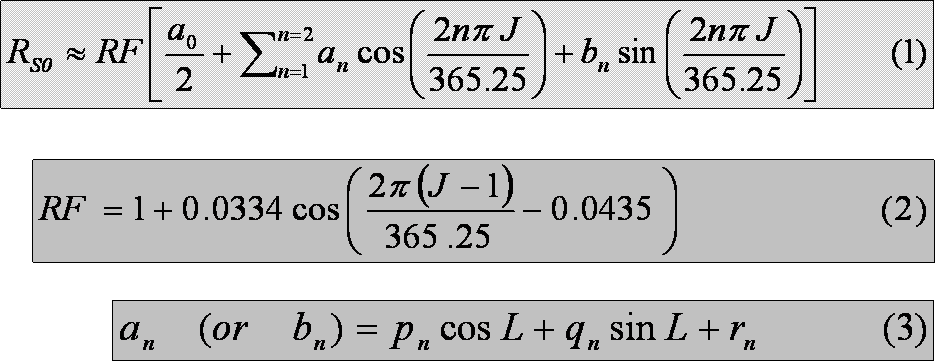
Next it is assumed that RS0 follows an annual cycle capable of approximation by the first two Fourier components as illustrated by Equation 1. To reduce the complication of the effect of the elliptical nature of the earth’s orbit the Radius Factor (RF) is included explicitly in Equation 1. To suitable accuracy, RF is obtained from Equation 2 (adapted from de Wit 2000).
For each site a set of Fourier components, an and bn, are chosen to form the envelope curve — the red curve in Figure 2. A priori it is expected that the Fourier components, an and bn, are dependent upon latitude, altitude and mean pressure. At the local or regional scale, factors such as dust or industrial haze, biogenic haze, intrusions of seabreeze humidity would also affect these components.
A technique of reiterative multiple linear regression was developed to determine the suitable values an and bn which in turn provided the envelope curve at each site. Thus: regression based upon all of a site’s observations is performed to provide a first guess; then those observations less than the first-guess envelope curve are excluded. This process of regression and data exclusion is reiterated until ~ 50 observations remain. For each site the final envelope is similar to that in Figure 1(b).
Then the a and b components are tabulated at each site. The value of these components may be spatially interpolated if required, and thus an estimate of RS0 for any Australian location and Julian day are readily obtained via Equation 1 — fulfilling Aim 1.
Plots of the (five) Fourier components of the envelope curves clearly show latitudinal dependence (Figure 2). It is suggested that some of the variation from this dependence is due to the factors mentioned earlier. As might be anticipated, the a2 and b2 components show the greatest relative noise. (This work has been replicated using a third Fourier component and it was found that the third a and b components were noisy and showed little dependence on latitude).
Lines of best fit for each of the components as modelled by Equation 3 are shown against the observed site components (Figure 2). L denotes latitude (negative in SH). Coefficients p,q and r are shown at Table 1. Thus, an estimate of expected Cloud-free Daily Global Radiation, RS0, for any latitude and any Julian day may be obtained from Equation 1 with the auxiliary Equations 2 and 3. So Aim 2 is achieved.
Using the parameterization described for latitude and Julian day, a series of examples representing locations (as per the blue circles in Figure 1) from Darwin to Hobart are presented at Figure 3. It is evident that the parameterization for latitude and Julian day only, as expressed by the red curves, yields a fair to good envelope fit. |

|
|
pn |
qn |
rn |
|
a0 /2 |
49.98 |
-11.33 |
-24.65 |
|
a1 |
9.06 |
-23.77 |
-10.25 |
|
b1 |
-9.03 |
6.69 |
9.65 |
|
a2 |
-3.08 |
-0.82 |
1.82 |
|
b2 |
-0.62 |
0.63 |
1.03 |